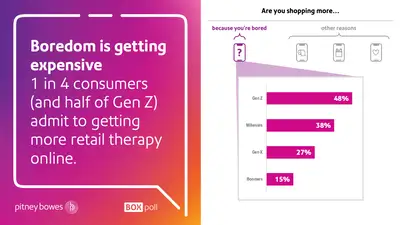
We're bored-shopping
The novelty of Disney+, home-baked bread, and staring out of the window appear to be wearing off. Thanks to YouTube, many have become expert knitters, haircutters, painters, gardeners, and jugglers. But now, according to the latest Pitney Bowes BOXpoll—a weekly consumers survey on current events, culture and ecommerce logistics—more than a quarter of consumers find themselves shopping because they’re bored

Perhaps unsurprisingly, boredom has it in for younger consumers
Half of Gen Zers (48%) appear to have allowed cabin fever to drive their shopping, while 38% of Millennials are feeling the same. Older consumers appear to have more going on: only 27% of Gen X and 15% of Boomers admitted to shopping because they’re bored.
Because bored-shopping has to start somewhere. We asked those bored consumers where their product discovery began. It turns out somewhere is still mostly Facebook…
- 15% more bored shoppers than shoppers overall start their journey on Facebook
- Instagram indexes 11% higher with bored shoppers
- Turns out Twitter may actually have a business model with 8% more bored shoppers
- Google searches were just 5% higher among bored shoppers
- TikTok drives 4% more bored-shopping
- And in a finding that is truly a silver lining for many brands, Amazon ranked near the bottom with only 3% more bored shoppers starting their purchases there.
What are bored shoppers buying?
Perhaps most surprisingly, bored shoppers are buying boring products. When we compared what bored shoppers were shopping more for online against consumers overall, we assumed bored shopping would drive interest in novel and unique products. Toys and games? Home décor?
Apparently, it’s toilet paper (though probably not via Facebook). Here are the product categories that indexed higher among bored shoppers than the norm (percentages are net difference versus respondents overall):
- Household supplies (toilet paper, detergent, etc.): +30%
- Apparel (clothing, but not footwear or accessories): +17%
- Personal Care/Beauty/Nutraceuticals: +14%
- Toys/Hobbies/Gifts (games, DIY, crafts, etc.): +14%
- Accessories (bags, purses, belts, hats, etc.): +12%
- Consumer electronics (TVs, stereo systems, etc.): +11%
- Footwear: +9%
- Home goods/décor/improvement (furniture, decorations, building/garden supplies): +8%
- Jewelry (rings, necklaces, etc.): +6%
- Automotive (car/motorcycle/boat parts and supplies): +5%
- Food/beverage (groceries, meal kits, alcohol, etc.): +5%
- Office supplies (print/paper products, writing tools, home office): +5%
- Pet supplies (dog/cat food, accessories, etc.): +4%
- Sporting goods (sports equipment & specialty apparel, not including ‘athleisure’): -3%
Appearing to indicate that boredom may not translate into greater physical activity, sporting goods were the only product category to index lower than the norm among bored shoppers. As our ‘State of the Consumer’ article points out, consumers’ purchases have been trending towards cautious & safe purchases as we approach holiday peak, perhaps indicating a calm before a storm of discretionary demand.
BOXpoll by Pitney Bowes, a weekly consumer survey on current events, culture, and ecommerce logistics. Conducted by Pitney Bowes with Morning Consult // 2094 US consumers surveyed Aug. 21-24, 2020. © Copyright 2020 Pitney Bowes Inc.
