Third party returns pickup is an unproven rookie
We know from our inaugural retailer survey that returns cost an average of 21% of order value—a tough pill to swallow in 2022, as brands are getting squeezed by tough labor markets, inflation, continued supply chain challenges, and higher customer acquisition costs.
This week on our quest to reveal the most ideal returns options – those that don’t open the floodgates, but don’t alienate the customer—we ran a qualifying round for a possible rookie contender: third-party pick-up. Following announcements that both DoorDash and Narvar are planning to enter the returns game via couriers bringing return orders to carrier drop-off locations, we asked consumers to weigh the concept against tried-and-true methods like scheduled and unscheduled carrier pick-up and shopper drop-off.
We started by zeroing in on which shoppers return the most—because their vote counts a little bit more. (Who ever said Returnament was a democracy?)
The worst offenders
Though we hate to point the finger at the generation already blamed for killing everything from beer to Applebee’s, we are obligated to report that Millennials may also be killing retailers’ margins when it comes to online return rates. (Though be fair, they are also the generation that shops online the most often, and return rates for online purchases are higher than brick-and-mortar purchases.)
- Millennials are the most likely generation to have made a return in the past month (33%, versus the average 24% of all consumers).
- They are also returning the largest number of items: an average of 4.1 items among all Millennials who made returns, versus the average 3.3 items for other generations.
Other serial returners include:
- Students. A whopping 42% of students returned an average of 4.1 items last month. It makes sense that shoppers who aren’t yet working full-time are vigilant about returning and collecting a refund for unwanted items.
- Shoppers who order online about once a week. 41% of weekly online shoppers returned an average of 4.6 items last month. With great purchasing power comes not-so-great returns volume.
- Parents. 34% of shoppers with children returned an average of 4.2 items last month. This group has a sizable demographic overlap with Millennials and frequent online shoppers.
Initiating a pick-up
Key takeaways:
- Using a retailer portal or carrier website to schedule a home pickup tied for the most-preferred ways to initiate a return pick-up—across all consumers and as well as our serial returner demographics.
- Unscheduled carrier pickup—seen as “convenient with no pressure” by some and “prime opportunity to be a victim of porch piracy” for others—places second.
- Despite being pitched as an ultra-convenient returns option sure to minimize trunk time, third-party delivery services come solidly in last place in every demographic for initiating a pick-up. From the consumer point of view, they already had to contact the retailer to get a return label or QR code. Going into a separate app (or portal) to schedule a pick-up likely seems more like a hurdle than a convenience.
Cost beats convenience (as always)
Key takeaways:
- Free drop-off and free unscheduled pickup tied for first place, while paid scheduled pickup ranked last. (Note that in this scenario, we did not specify whether paid pickup was carrier-provided or from a third party.)
- Just 10% of all shoppers ranked paid pick-up first. For the other 90%, the convenience of scheduled pick-up doesn’t warrant paying if there’s a free alternative.
- However, paid pickup is slightly more popular for some serial returner demographics than average, with 16% of Millennials and 15% of parents ranking it their first pick. For this (small) group, outsourcing this part of the to-do list is worth paying for.
Key takeaways:
- Given our above findings about cost and convenience, it doesn’t come as a shock that less than half of shoppers say they’re willing to pay anything for any pick-up service option, no matter who does the scheduling. Those who would pay are willing to fork over between $8-$10.
- No variety of paid pickup emerged as a clear favorite, as the share of “percentage of consumers who would pay” was a statistical tie between all three options. (As such, we’re giving each contestant a half-point.)
- Third-party pickup raked in almost a full dollar more than carrier-scheduled or retailer-scheduled pickup. We suspect this is partly because consumers are already familiar with the third-party food delivery model and accompanying fees, and partly because a third-party option is more likely to offer a more precise pickup time than the generous windows typically provided by carriers.
- Most surprisingly, among two demographics who shop online and return online most often—Millennials and parents (who share significant demographic overlap)— about half are willing to pay for any of the pick-up options presented.
Retailers who leverage a postal returns solution then have the option to either charge for home pick-up for certain consumers (ahem, serial returners), or tout the value of a free home pickup solution.
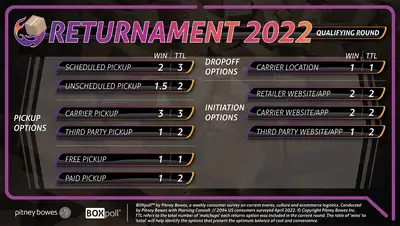
At the close of our qualifying round of Returnament 2022, here is where our scoreboard stands:

The method to the Returnament madness
We award a maximum of 1 point per return option in each matchup. First place winners earn 1 point. If multiple options are tied for top-ranked value, the winning options are awarded 1 point. If all options in a matchup are statistically tied, all contenders win 1 point. Second place options earn 0.5 point, while last place options earn no points.
BOXpoll™ by Pitney Bowes, a weekly consumer survey on current events, culture, and ecommerce logistics. Conducted by Pitney Bowes with Morning Consult // 2094 US consumers surveyed April 2022. © Copyright Pitney Bowes Inc.
